While modern cars come with many advanced safety systems and features, they still end up in accidents. The global share of damaged vehicles is 52.4%, so statistically, every second car suffers harm after leaving a manufacturing plant. What’s even more interesting – some vehicle brands are more prone to accidents than others.
Automotive experts from automotive data company carVertical did some research to find out which car brands in the UK have the most damaged vehicles and to determine the average monetary value of those damages.
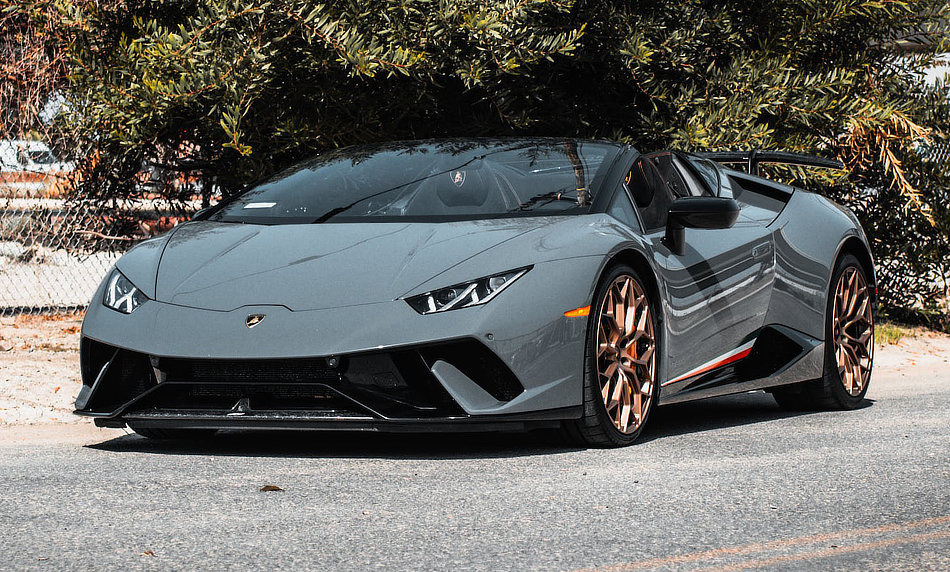
1 out of 3 Lamborghinis have been in an accident
Lamborghini takes the top spot on the list of the most damaged car brands in the UK – 35.3% of checked Lamborghini history reports had damage records, followed by Ferrari (27.6%). It would seem that drivers of these fast cars don’t always know how to handle so much power under the hood, and often end up damaging their cars.
Sports cars are followed by regular vehicles: Vauxhall (27.1%), Fiat (26.5%), and Seat (25.3%). These manufacturers offer affordable and economical cars that serve as daily commuters, so it’s no wonder they often end up in accidents.
Mazda (13.4%), Tesla (11.9%), and Land Rover (11.5%) are the 3 least-damaged brands.
Tesla and Land Rover are expensive and full of safety systems. They’re usually bought by more mature drivers, which explains the low damage rating.
“Every 5th car or 21.8% of vehicles checked on our car history platform in the UK had been damaged in the past. Although this figure is relatively low compared to the rest of Europe, some cars seem to be more prone to accidents,” – says Matas Buzelis, the Head of Communications at carVertical.
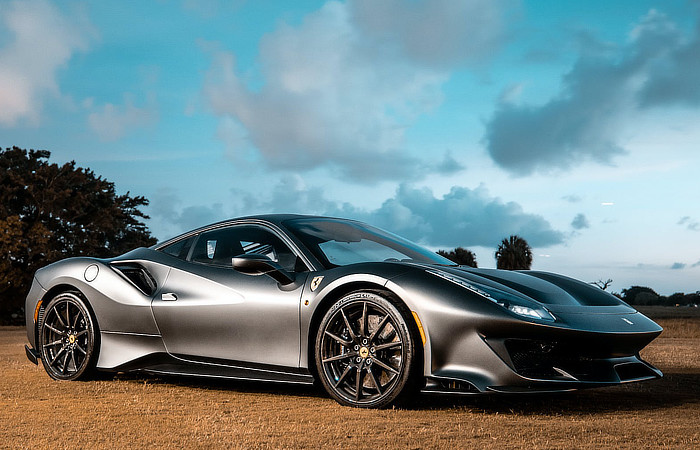
Ferrari boasts the most expensive damages
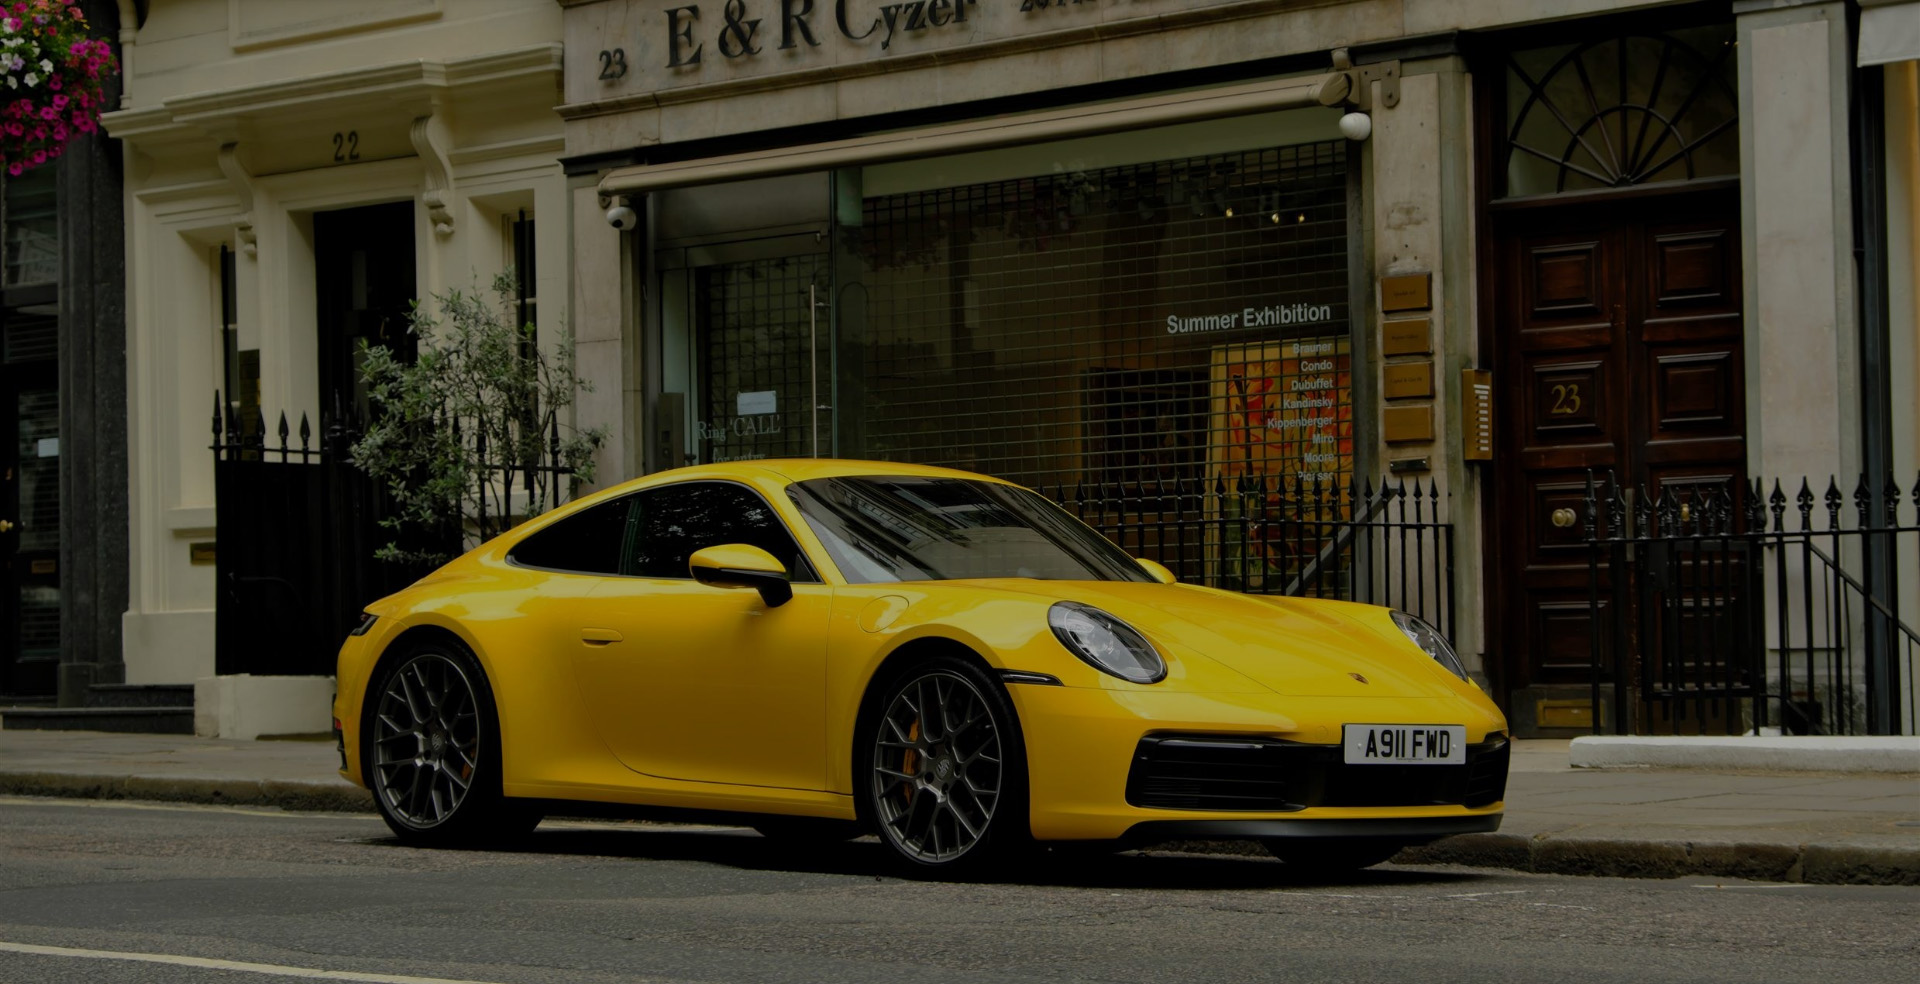
Unsurprisingly, the highest average damage value is attributed to Ferrari (£190,381) and Lamborghini (£58,701), whose damages are several times more expensive than those of other brands on the list. Porsche (£22,307), Tesla (£19,157) and Citroën (£11,033) fall behind these makers with slightly lower repair costs.
While exotic cars boast tens of thousands in expenses, the average damage value of some more popular brands is much lower: BMW – £4,433, Volkswagen – £3,628, and Toyota – £6,405. The research also found that the global average damage value is €3,124 (approx. £2,700), which helps to compare the damage expenses.
“In terms of price, supercar accidents are on another level. Even a minor scratch can bring some eye-watering numbers, so it’s no wonder that Ferraris and Lamborghinis top the list. Interestingly, Citroën seems to be in a relatively high position in terms of the average damage value, higher than some premium manufacturers,” – says M. Buzelis.
Porsche has the highest average count of damage records
The list of the highest average count of damage records per brand is similar to the list of most often damaged brands. Lamborghini takes the top spot with 0.49 damage events on average per car, followed by Ferrari (0.35) and Opel (0.31).
Mazda (0.15), Land Rover (0.14), and Tesla (0.14) have the lowest share of damage records.
“There is some correlation between the most popular damaged car brands and the highest average count of damage records. However, the average age of checked cars on our platform is about 9.5 years and, normally, vehicles of some brands are damaged twice over that period,” – says M. Buzelis.
The research has also discovered several extreme cases, including a Mercedes-Benz with 35 damage records on a history report. Multiple car damage events are common and create even greater risks, as such vehicles may not be safe to drive.
How was this research conducted?
The research was conducted by analyzing damage data from 2 million carVertical history reports. Automotive data company collects data from reliable databases and institutions, processes it, and provides users with history reports, featuring mileage, damage, ownership, and other essential information.
The primary goal of the research was to find out how common damage records are among different car brands. Therefore the company’s data experts analyzed actual car history reports generated for the platform’s users.
The average monetary value of damages was calculated by summing up all the accidents of a particular brand and finding the average. The results reflect how severely cars of certain brands are damaged and how expensive the repairs usually are.
Another piece of data reveals the average number of damage events per car within a brand, which was calculated by counting the number of accidents of a particular brand and dividing it by the total number of history checks for that brand.